Water Quality in the Amu Darya River basin
Probability curve of the Amudarya river flow
Water content of the Amudarya river
Water salinity along the Amudarya river per gauging station
Middle reaches
Dynamics of water abstraction from and discharges into middle reaches of Amudarya river
Dynamics of salt leaching in the middle reaches of Amudarya river
Lower reaches
Dynamics of water and salt inflow to South Prearalie
Dynamics of water abstraction from and discharges into lower reaches of Amudarya river
>Dynamics of salt leaching in the lower reaches of Amudarya river
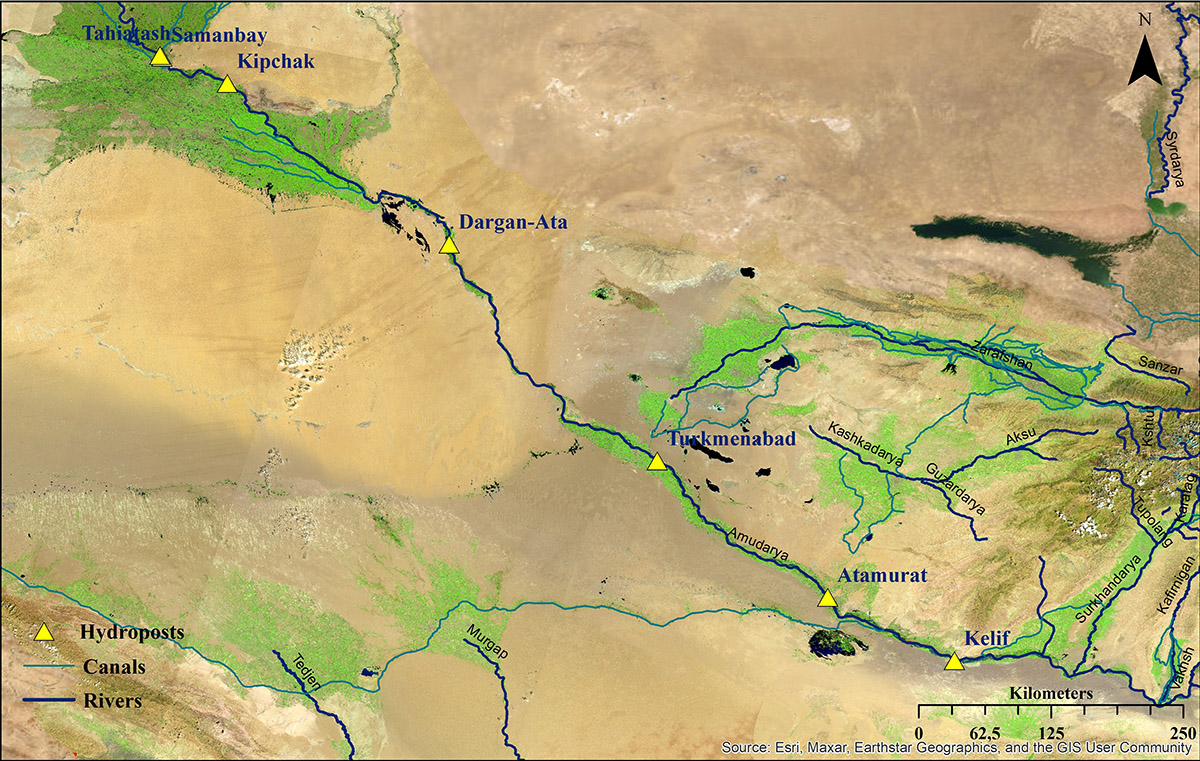
GIS-map
Precise and informative GIS maps that reflect the spatial distribution of water quality indicators within the Amu Darya River basin. The application of GIS not only enables effective data visualization but also allows for dynamic analysis, the identification of changing patterns, and the detection of potential environmental risk zones.
Analysis of water chemical content dynamics is achievable through GIS mapping. The spatiotemporal distribution of chemical concentrations allows for:
1. Trend identification: Determining increases or decreases in specific element concentrations over temporal scales.
2. Spatial analysis of variability: Locating areas where chemical concentrations have undergone the most substantial changes.
3. Comparative analysis of temporal patterns: Evaluating both seasonal and long-term variations in chemical concentrations.
4. Impact assessment: Identifying zones within a water body most affected by natural (e.g., climate change) and anthropogenic (e.g., economic activity) factors.
5. Prediction: Utilizing historical data to forecast future changes in water quality and assess potential risks.
Author: L.V. Sychugova, SIC ICWC
Time Interval: 1991-2022
Indicators:
Calcium (Ca)
Chlorides (Cl)
Hydrocarbonates (HCO3)
Magnesium (Mg)
Mineralization
Sodium and potassium (Na+K)
Sulfates (SO4)
Gauging station